

Nigeria has spent more than two decades attempting to engineer a commercially viable electricity market. Through the unbundling of state-owned monopolies, widespread asset privatisation, the establishment of an independent regulator, and the introduction of a cost-reflective tariff framework, the country has deployed virtually every standard playbook item for power sector reform. Furthermore, the Federal Government has repeatedly committed substantial public resources and liquidity bridges to keep the illiquid market afloat. Yet for most households and businesses, the defining feature of the sector remains unchanged: electricity supply is unreliable, expensive and insufficient for productive economic activity.
The challenge is no longer simply whether Nigeria can construct generation capacity. While the country boasts an installed grid capacity of 13,625 megawatts (MW), average available capacity for dispatch routinely hovers between 4,200 MW and 5,400 MW. More critically, due to persistent transmission bottlenecks and severe distribution losses, the actual volume of energy safely wheeled and commercially delivered to end-users is substantially lower.
Based on the GDP data released by the National Bureau of Statistics (NBS), in the second quarter of 2026 (Q2 2026), activities in the Electricity, Gas, Steam and Air Conditioning Supply sector contracted by 10.63% year-on-year in real terms, following a severe 15.30% contraction in Q1 2026. While the moderated pace of decline might offer a superficial impression of stabilisation, in our view, it must not be mistaken for structural recovery. The industry remains locked in a severe liquidity trap – unable to monetise its vast natural gas reserves, modernise its generation fleet, or translate ambitious statutory reforms into bankable cash flows. The ultimate issue is whether Nigeria can enforce commercial discipline consistently enough to break a perpetual cycle of state intervention.
A Sector Restructured, Not Repaired
To understand the systemic fragility of the current power market, it is essential to examine the historical sequence of reform. For decades, electricity was operated as a vertically integrated state monopoly defined by under-investment, minimal cost recovery, and severe operational inefficiencies. Tariffs were maintained at artificially depressed levels, and budgetary allocations were grossly inadequate. The Electric Power Sector Reform Act of 2005 dismantled this monopoly, unbundling the utility into separate generation companies (GenCos), distribution companies (DisCos), and the Transmission Company of Nigeria (TCN) – while establishing the Nigerian Electricity Regulatory Commission (NERC) as an independent regulator tasked with overseeing a competitive, market-driven electricity industry. This culminated in the landmark 2013 privatisation exercise, which saw private investors acquire generation and distribution assets, while the government retained the transmission network.
Nigeria’s 2013 power-asset sale generated substantial acquisition costs, financed largely with domestic bank debt. Incomplete information on network conditions, customer records, and rehabilitation needs may have led some investors to underestimate required capital. Subsequent tariff shortfalls, weak collections, and market arrears have constrained further equity investment. Private acquirers inherited severely degraded distribution networks, technical unmetering, and tariff frameworks that failed to reflect macroeconomic realities. Concurrently, generation companies faced persistent settlement shortfalls, which triggered payment defaults to natural gas suppliers. Ultimately, Nigeria did not privatise a functional electricity market; it transferred distressed physical infrastructure into a value chain where commercial counterparties could not clear their obligations.
Generation Deficits and the Mirage of Nameplate Capacity
While Nigeria’s installed grid capacity stands at 13,625MW, electricity actually available to Nigerians presents a starkly different reality. Regulatory data indicates average available generation capacity (actual power generated) fell to 4,457MW in Q1 2026. For an economy exceeding 200 million people, and a ₦441.5 trillion ($307 billion) nominal GDP (2025), an operational generation baseline of less than 4.5 gigawatts (GW) represents a severe binding constraint on macroeconomic expansion. The divergence between installed and available output highlights severe operational bottlenecks. A power plant may remain commercially unavailable due to turbine breakdowns, gas supply shortages, or unresolved liquidity disputes. Even when fully operational, grid operators may refuse dispatch if the transmission network cannot wheel the load or if downstream collections provide no assurance of payment.
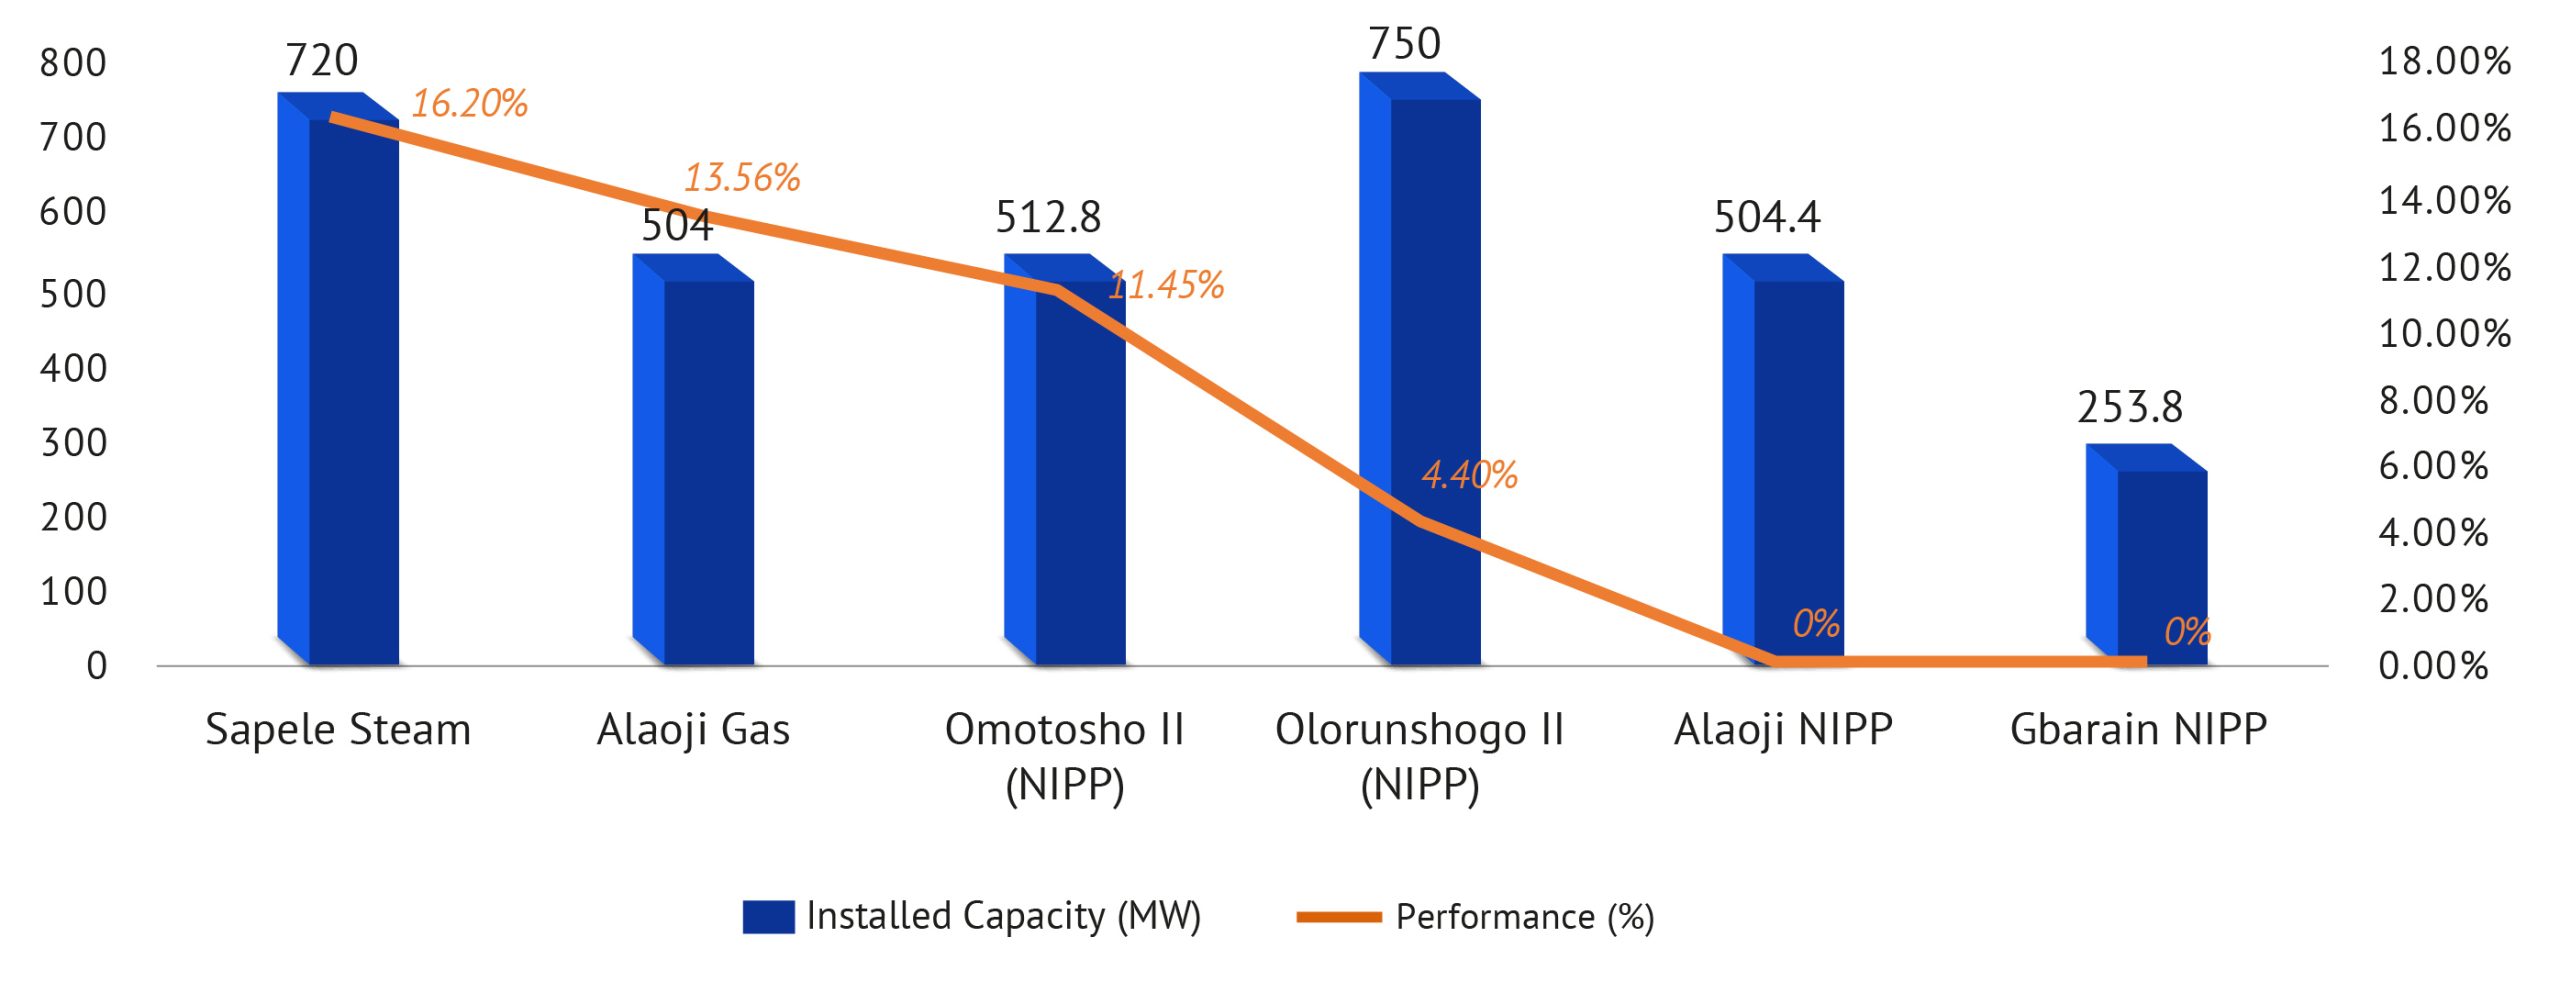
Figure 1: Installed Capacity vs. Plant-Level Performance of Major Plants in Q1 2026 (%)
 Source: NERC
In Q1 2026, Nigeria’s 28 grid-connected plants operated at an aggregate availability factor of just 32.72%. In effect, more than two-thirds of the nation’s total generation fleet was offline or constrained at any given point during the quarter. These metrics illustrate that adding new generation capacity yields diminishing returns if existing assets cannot secure firm gas agreements, execute routine maintenance, receive timely settlements, and evacuate power.
Grid Bottlenecks and Transmission Vulnerabilities
Even when GenCos produce power, electricity must be evacuated across long distances without triggering frequency instability. Nigeria’s high-voltage transmission network has historically lacked the redundancy required to manage large load swings. Persistent imbalances between generation output and distribution off-take frequently force system frequency outside safe limits, exposing transformers to severe stress and triggering grid collapse.
To be sure, nominal progress has been recorded on grid expansion. TCN reported that its transmission wheeling capacity increased from circa 7,000 MW to 8,700 MW as at 30 June 2026, following investments in transformers, substations and transmission-line reconductoring. However, the 8,700 MW figure is based on system simulations undertaken by the Independent System Operator when it was within TCN, rather than a capacity level that has been physically tested under sustained grid conditions. The Federal Government also planned to commission 20 completed transmission projects before 31 December 2026, principally to relieve evacuation bottlenecks and support a 6,000 MW electricity-supply target. However, the operational benchmark of a transmission network is its structural reliability under everyday stress, not rated peak capacity. However, in our assessment, nominal wheeling capacity figures can be misleading. The operational benchmark of a transmission network is not its rated peak capacity under ideal conditions, but its structural reliability under everyday operational stress – including sudden plant trips, localised distribution load-shedding, and adverse weather conditions.
Transmission grid modernisations require sustained multi-year capital expenditure programmes. Grids cannot be re-engineered through short-term project cycles vulnerable to political shifts and fiscal revenue shortfalls. Without continuous investment in automated protection systems, expanding generation capacity will simply result in stranded power.
Distribution as the Value Chain’s Vulnerable Core
The most critical structural failure point resides within the distribution network, the sole commercial interface of the entire value chain. It is here that energy is converted into revenue, end-users are billed, and liquidity is remitted upstream. In Q1 2026, Nigeria’s 11 DisCos received 7,148 GWh of electricity but billed end-users for 5,967 GWh, producing an energy-accounting efficiency of 83.5%. In value terms, DisCos billed ₦756.93 billion out of ₦955.19 billion worth of electricity received, equivalent to a billing efficiency of 79.2%. They collected ₦597.56 billion, or 78.9% of billed revenue. Accordingly, only 62.6% of the value of electricity received was converted into cash, implying a combined commercial leakage of 37.4%. These metrics demonstrate a severe cash flow leak. Even after electricity was successfully billed, DisCos failed to collect 21.05% of its value in Q1 2026, leaving ₦159.37 billion in unpaid revenue and further weakening their ability to pay generation companies, fund network investment and improve service delivery.
Figure 2: Available Generation Capacity (MW) (Q1-2025 – Q1-2026)
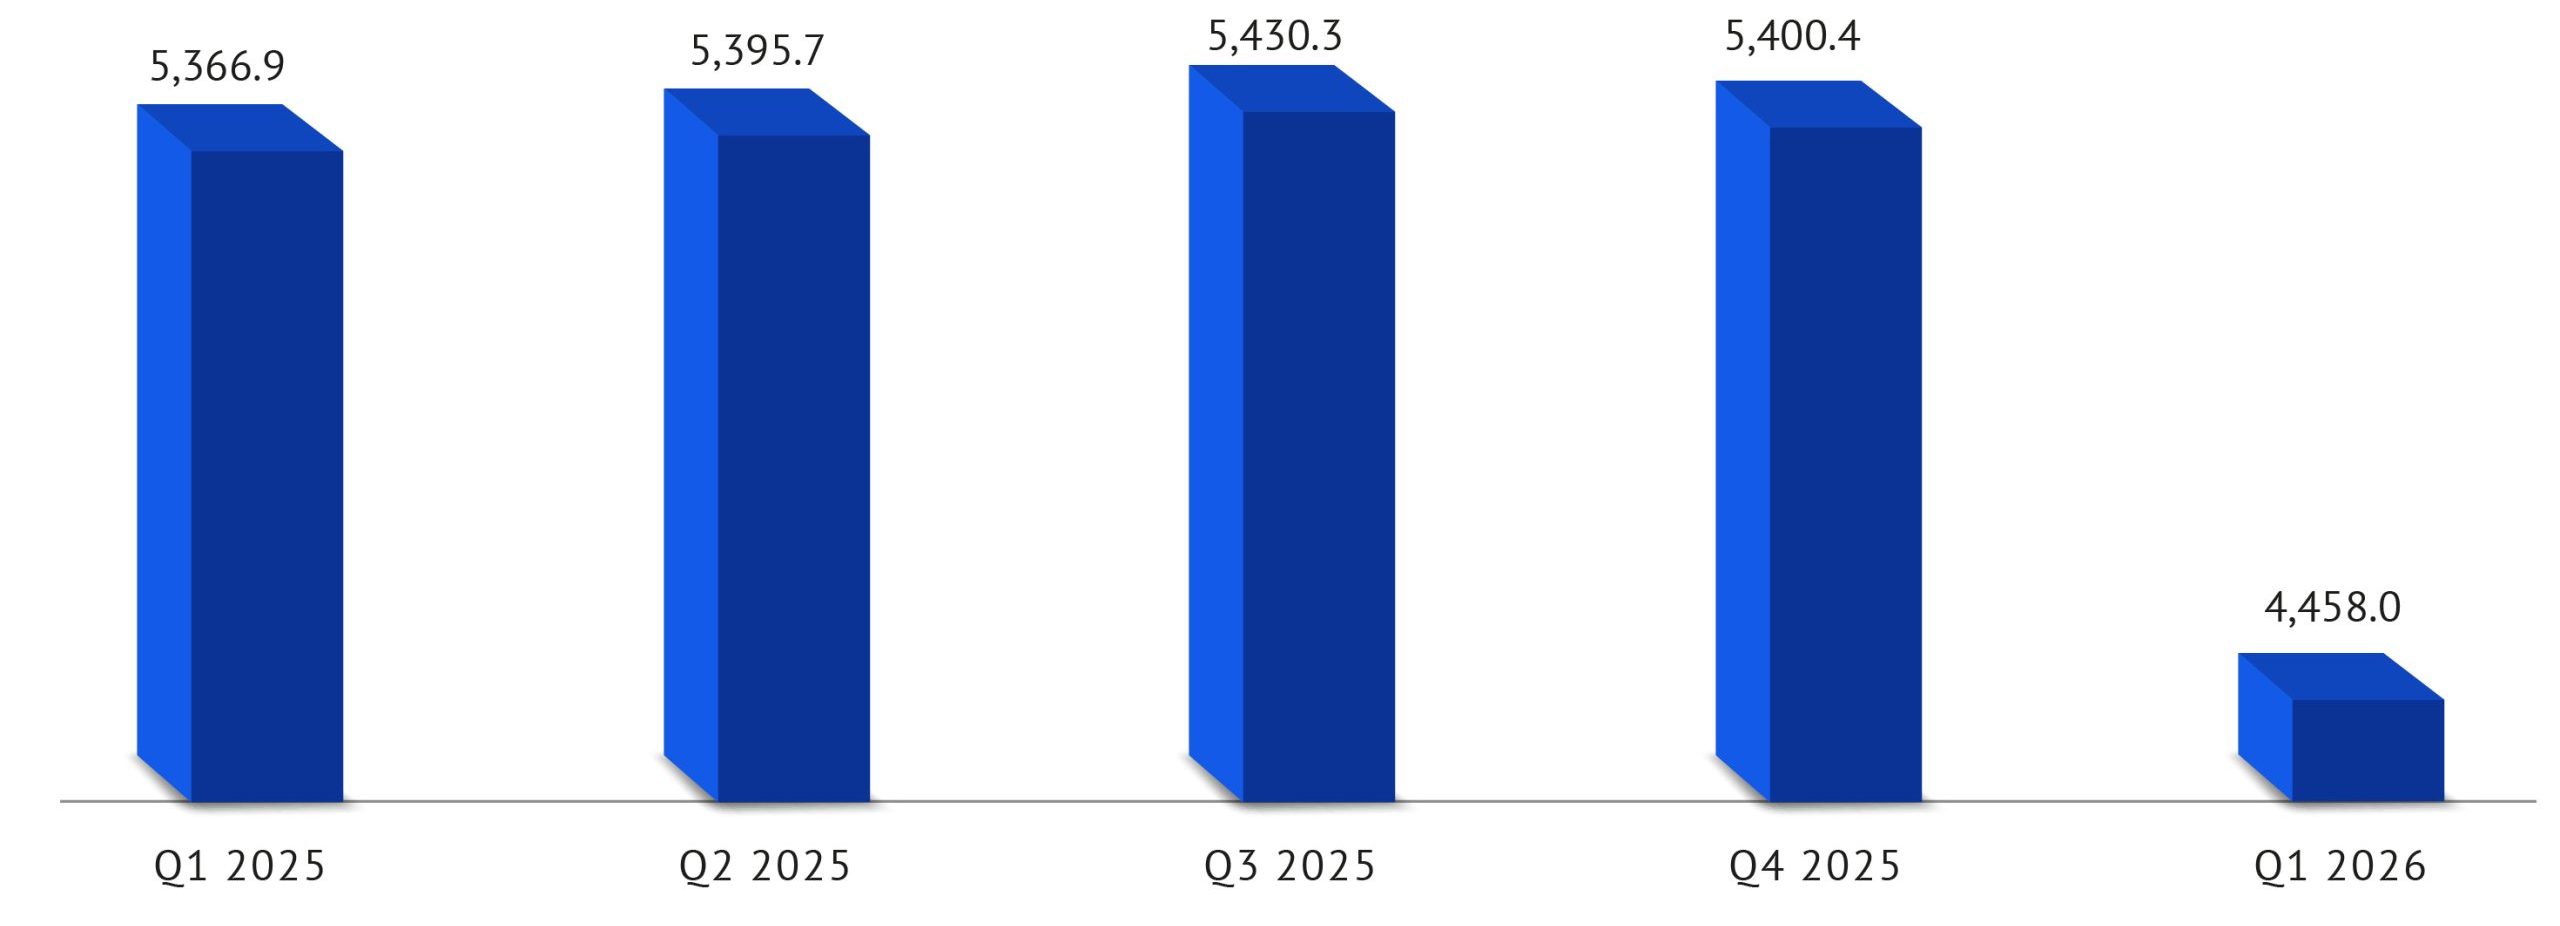
*This quarterly available generation is evaluated within the context of Nigeria’s installed generation capacity of 13.635MW
Source: NERC
Across the industry, the national weighted average Aggregate Technical, Commercial, and Collection (ATC&C) loss rate stood at 37.4% in Q1 2026. This remains more than double the regulatory target of 16.9%, resulting in a quarterly revenue shortfall of ₦140.64 billion. While this is a marked departure from exaggerated estimates, it remains more than double the regulatory MYTO target of 16.9%, representing a quarterly revenue shortfall of ₦140.6 billion.
The privatisation model assumed operators would inject equity to meter customers and eliminate commercial theft. In reality, many DisCos remain balance-sheet impaired and unable to secure commercial funding for capital-intensive projects. Without aggressive rollouts of smart metering infrastructure and strict enforcement against non-paying customers, these entities will remain incapable of clearing their market operator invoices, leaving the sector permanently starved of liquidity.
Macroeconomic Drag and the Exorbitant Price of Darkness
The power sector crisis is a major binding constraint on macroeconomic productivity. The World Bank estimates chronic grid instability costs Nigeria between 5% and 7% of its GDP annually. Commercial enterprises report grid outages averaging eight hours per day, forcing reliance on self-generation via industrial generators. Captive diesel generation costs commercial operators between $0.40 and $0.46 per kilowatt-hour (kWh), compared to historical grid tariffs averaging 8 cents. This differential erodes operating margins, inflates retail inflation, disincentivises foreign investment, and severely harms regional competitiveness.
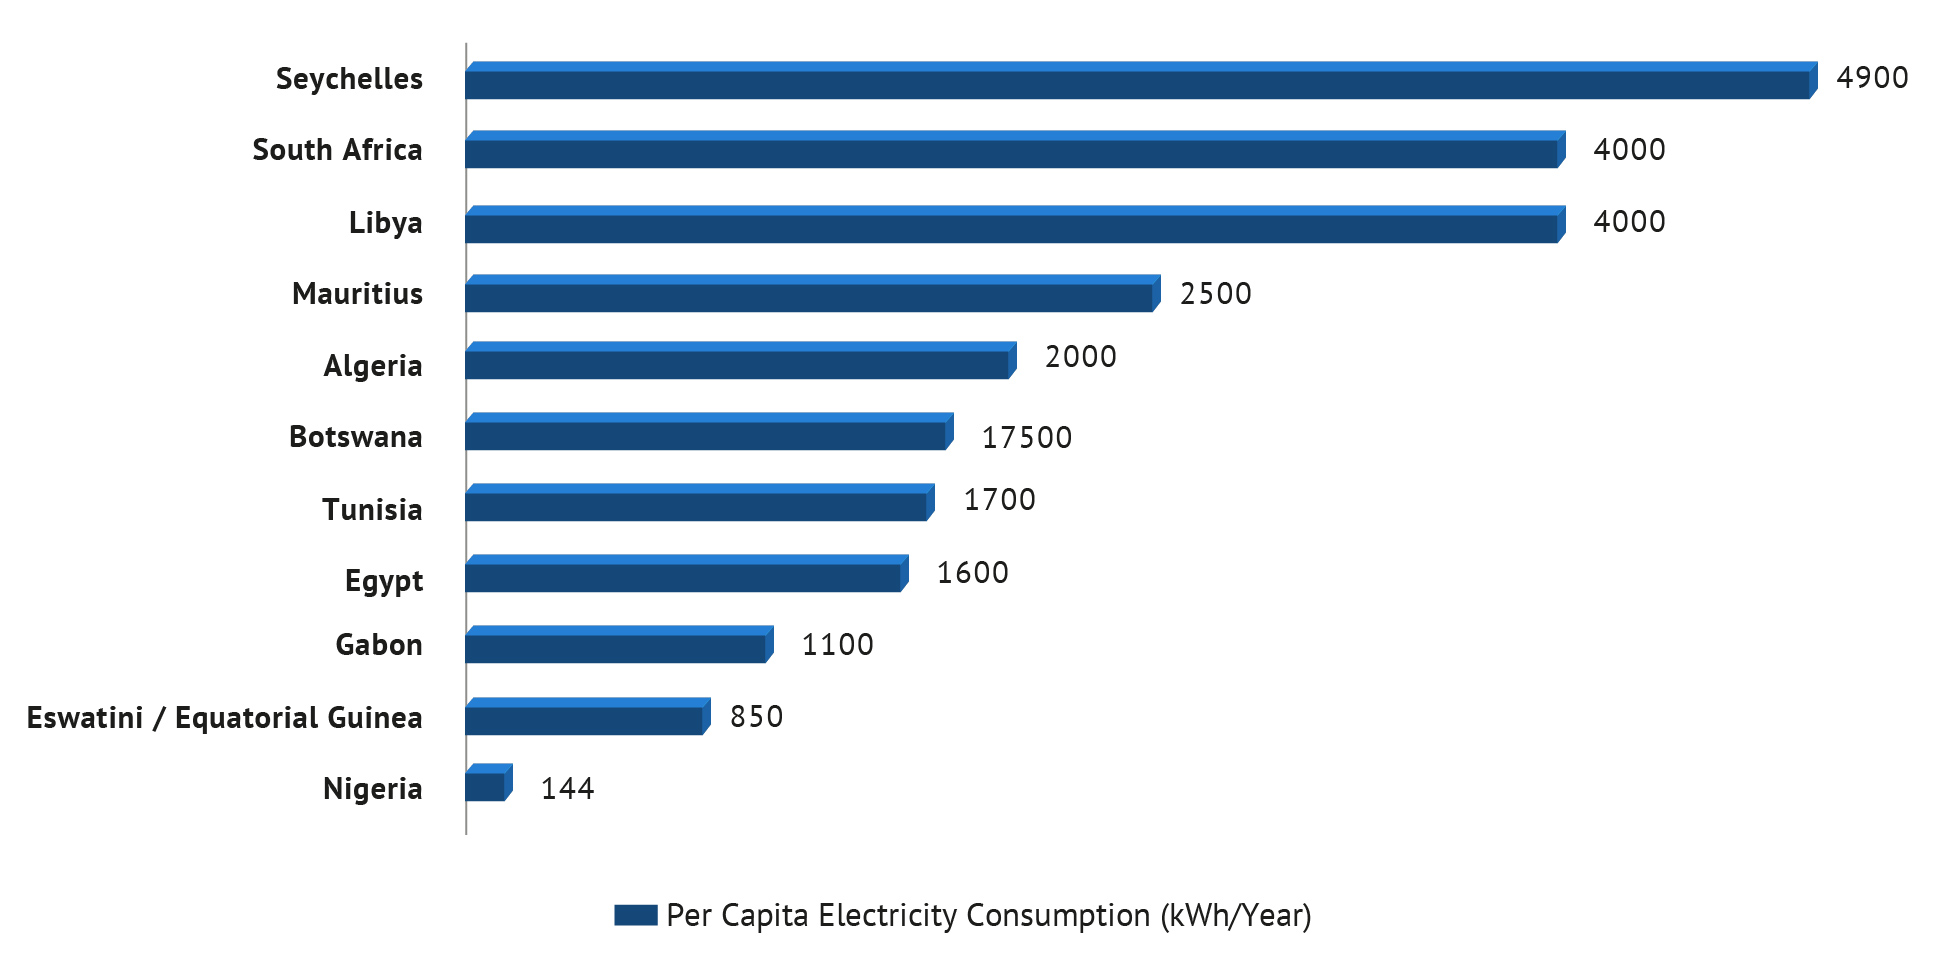
Figure 3: Per Capita Electricity Consumption (kWh/year) in Africa – Top 10 vs Nigeria
Source: The World Bank
Nigeria’s annual electricity consumption stands at a paltry 144 kWh per capita. This not only significantly lags regional peers like Ghana (351 kWh) and continental industrial leaders like South Africa, (over 4,000 kWh), but it also remains well below the broader African average, which is estimated at approximately 617 kWh. This metric reflects a diminished capacity to power industrial production, support digital infrastructure, or deliver reliable healthcare. Although Nigeria’s electricity-access rate increased to 62.5% in 2024 from 61.2% in 2023, 37.5% of the population – circa 90 million people – remained without access to electricity. The shortfall has reinforced a dual energy economy: larger firms increasingly deploy captive generation and hybrid solar solutions, while micro, small and informal enterprises remain disproportionately exposed to outages, high generator-fuel costs and associated productivity losses.
Liquidity Interventions vs Structural Solvency
Recognising that mounting sector debt threatens to paralyse domestic bank balance sheets and upstream gas production, the Federal Government has intensified interventions to clear market arrears. Unfunded historical subsidy liabilities account for circa 96% of outstanding unpaid invoices owed to GenCos, with an aggregate economic value estimated at ₦6 trillion. In 2025 alone, the government accrued a gross tariff subsidy obligation of ₦1.928 trillion.
To address these liabilities, the government launched the ₦4 trillion Power Sector Debt Reduction Programme. The first series raised ₦501 billion in January 2026, followed by a second series in August and September 2026 raising a further ₦728.9 billion. However, in our view, balance-sheet debt settlements must not be confused with fundamental market reform. Debt issuance relieves immediate liquidity pressure but does not alter the operational mechanics generating arrears. To establish long-term solvency, cost-reflective tariffs must be fully implemented. While low-income households require targeted protections, such subsidies must be explicitly budgeted and fully funded. Unfunded subsidy commitments simply shift fiscal liabilities back onto utility balance sheets.
Benchmark Lessons and Comparative Models
The operational trajectories of other emerging markets demonstrate that power sector restructuring can deliver reliable energy when reform sequencing is strictly maintained.
- Vietnam: Combined rapid generation fleet expansion with parallel, state-backed investments in high-voltage transmission lines. Installed capacity expanded from 11,600MW in 2005 to over 80,000MW by 2026, matching an annual electricity demand growth rate of 10% to 12%. Crucially, Vietnam ensured that transmission grid expansion matched generation procurement step-for-step.
- Egypt: Fast-tracked the construction of 14,000MW of gas-fired combined-cycle capacity within six years. This expansion was anchored on sovereign payment guarantees, long-term gas feedstock contracts, and transparent cost recovery mechanisms that assured international debt financiers of timely debt service repayment.
- Morocco: Under its National Energy Strategy, Morocco combined large-scale renewable projects – such as the Noor Ouarzazate solar complex – with heavy investment in grid automation and interconnections. Consequently, the proportion of manufacturing firms reporting electrical outages fell from 35% in 2013 to 11% by 2023.
The central lesson for Nigeria is that reform sequencing is paramount. Attempting to reform generation tariffs without enforcing collection discipline at the distribution level, or expanding generation capacity without upgrading transmission lines, guarantees structural failure.