


Nigeria’s economic reforms have placed a considerable burden on households and businesses, with petrol subsidy removal and exchange-rate adjustment raising costs well before their anticipated benefits could materialise. Stronger public finances were central to the justification for that adjustment: governments would retain more revenue, reduce dependence on borrowing and acquire greater capacity to finance infrastructure and public services. With gross federation revenues estimated to have increased by 69% in real terms between 2023 and 2025, while net distributable revenues rose by 60%, there is now substantial evidence that the revenue side of the bargain is taking shape.
For citizens and businesses, however, the more relevant question is what this improvement will buy. Higher collections offer little reassurance where public services remain inadequate, infrastructure projects fail to reach completion and financing obligations absorb resources before governments can deploy them elsewhere. Nigeria’s fiscal outlook increasingly depends on how the additional revenue is distributed, the commitments being made against it and the quality of expenditure it supports.
How Much of the Recovery Can Governments Rely On?
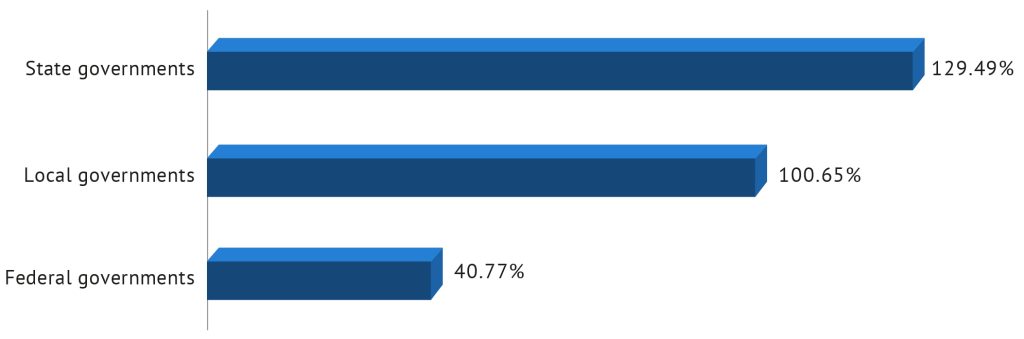
Although exchange-rate adjustment has contributed to the increase in naira receipts, the reported real revenue growth indicates that governments have also gained purchasing power after accounting for inflation. The distribution of that improvement has been uneven, with state governments receiving the largest increase in federation revenue flows. Between 2023 and 2025, their receipts rose from ₦3.21 trillion to ₦7.37 trillion at constant 2019 prices, compared with an increase from ₦3.51 trillion to ₦4.93 trillion for the federal government. States accounted for approximately 54% of the combined increase across the three tiers, reflecting higher allocations, refunds, settlement of outstanding federal obligations and intervention funds.
This has given states greater scope to expand expenditure, while the federal government continues to finance national infrastructure, security, debt service and other obligations from a more constrained revenue base. However, the distribution of spending responsibilities also places substantial demands on state budgets, particularly in education, healthcare and infrastructure. The resulting divergence is visible in expenditure composition: capital spending rose from 47.5% to 61% of aggregate state expenditure between 2023 and 2025, while its share of federal spending fell from 20.9% to 15.8%. These figures illustrate the different pressures on federal and state finances, rather than establishing that development responsibilities rest primarily with one tier.
For states, the durability of their additional resources will determine how much expenditure can safely be sustained. Refunds and the settlement of longstanding obligations can finance project completion or verified arrears, but provide a less dependable basis for permanent payroll increases, recurring subsidies or facilities with substantial operating costs. Separating exceptional receipts from recurring revenue would help prevent the current expansion in resources from leaving future budgets with commitments that weaker collections cannot support.
Why a Lower Debt Ratio Still Leaves Little Room
Nigeria’s public debt-to-GDP ratio is estimated to have fallen to 40% in 2025 and is projected to decline further to 38.1% in 2026, indicating a reduction in debt relative to the size of the economy rather than necessarily a fall in the nominal debt stock. Significant improvement in debt service relative to revenue in recent years has also been observed, although some deterioration is anticipated in 2026. These developments provide a more balanced picture than a narrative of uninterrupted fiscal decline, but they do not resolve the government’s underlying revenue constraint. Debt-to-GDP relates public liabilities to the size of the economy, whereas debt-servicing capacity depends more immediately on the portion of economic activity that government can convert into revenue. The delineation is evident in the IMF’s estimate that federal interest payments absorbed 53.2% of FGN revenue in 2025, leaving a substantial claim on receipts before other expenditure priorities could be accommodated. That figure relates specifically to the federal government and should not be read as a consolidated public-sector measure.
For this reason, Nigeria’s debt assessment requires several indicators rather than a single headline ratio. Debt-to-GDP remains relevant to the overall liability burden, while interest-to-revenue shows the recurring budgetary cost of borrowing. Maturing obligations and gross financing requirements reveal how much funding must be secured, even where the debt ratio is falling. A more favourable debt ratio consequently improves the outlook without necessarily giving the government much freedom over its next budget.
Figure 1: Real Growth in Federation Revenue Flows by Tier of Government, 2023-2025 (%)
Source: The World Bank
States Have More Money. Have They Gained Independence?
State governments’ federation revenue flows increased by 129.5% in real terms between 2023 and 2025, substantially expanding their spending capacity without producing a comparable reduction in dependence on shared revenues. Across the states, Lagos and Enugu were the only ones whose internally generated revenue exceeded recurrent expenditure in 2025, with coverage ratios of 160% and 377%, respectively.
Their performance reflects different combinations of economic capacity, taxpayer coverage and collection efficiency.
Lagos benefits from its concentration of formal employment and commercial activity, which provides a stronger base for own-source revenue. Its revenue administration has also incorporated self-service digital platforms through which taxpayers can generate identification numbers, file returns and make electronic payments without visiting physical offices. Over 2021–2025, federation transfers accounted for an average of 28% of Lagos State’s total revenue, compared with 72% for the other states collectively when Lagos is excluded. This stronger internal revenue base gives Lagos greater discretion over expenditure and reduces its exposure to fluctuations in monthly allocations. Enugu’s recent improvement has been driven more visibly by an expansion of taxpayer coverage and changes in collection practices. Its IGR increased by 732% in real terms between 2023 and 2025, supported by the registration of previously unregistered business owners, landlords, contractors and other self-employed taxpayers. Automated collections and compulsory cashless payments directly into the state treasury helped reduce leakages and phase out unauthorised roadside collectors. Enugu’s experience demonstrates how revenue administration can improve collections beyond the formal salaried workforce, although sustaining the gains will require continued compliance and effective enforcement.
Across the wider group of states, aggregate IGR increased by 55% in real terms between 2023 and 2025, but remained sufficient to cover only about half of recurrent expenditure in 2024–2025. Collections also remained concentrated in a limited number of sources: PAYE accounted for an average of 72% of state IGR in 2025, compared with 5.4% from direct assessment and just 0.1% from property taxes. This composition leaves most states heavily reliant on income collected from formal employment, with comparatively little revenue mobilised from other potential sources.
States with less urbanised and less commercially diversified economies face a narrower taxable base, while weaknesses in taxpayer registration, data integration and property administration further restrict collections. Stronger taxpayer identification, digital filing and payment systems, third-party data and modern property registers have been identified as priorities for improving revenue performance. Federation transfers still accounted for more than three-quarters of revenue in all but four states in 2025, leaving expenditure plans exposed to changes in shared receipts. Greater fiscal independence will therefore require states to extend taxpayer coverage and improve compliance alongside measures that support a broader economic base, rather than rely on higher allocations to finance an expanding budget.
Bigger Allocations, Same Dependence?
Higher federation allocations have given Nigeria’s states greater scope to address development needs, but the opportunity to spend more should also be used to strengthen the capacity to generate revenue internally. Financing permanent commitments from exceptional receipts or assuming that transfers will continue to rise would leave state budgets exposed when revenue conditions become less favourable.
The experiences of Lagos and Enugu offer useful lessons in broadening taxpayer coverage, improving collection efficiency and reducing leakages. Replicating these gains will require approaches suited to each state’s economic base, alongside investment in the infrastructure and services that enable businesses to grow. Digital collection platforms can improve administration, but their contribution will remain limited where taxable activity is narrow and compliance is weak.
We expect stronger allocations to provide some near-term relief, although greater fiscal autonomy will depend on whether states use that relief to reduce their underlying revenue vulnerabilities. The challenge is to emerge from this period with a broader tax base and commitments that can be sustained through weaker revenue conditions. Otherwise, Nigeria’s states could find themselves managing bigger budgets without becoming any less dependent on Abuja.